NETTER-1: ~3x longer PFS in patients after progression on an SSA1-3
Statistically significant improvement in PFS (primary end point)
PFS (as assessed by independent central review according to RECIST v1.1 by radiologists unaware of the treatment), defined as the time from randomization to documented disease progression or death from any cause2,4
Primary analysis: mPFS was not reached with LUTATHERA + SSA (95% CI, 18.4-NE) vs 8.5 months with SSA alone (95% CI, 6.0-9.1)1,2
The primary PFS analysis data cutoff was July 24, 2015. Median duration of follow-up was 14 months1,2
LUTATHERA + SSA demonstrated >2 years PFS in 2L patients3
Long-Term Post Hoc PFS Analysis (Centrally Assessed)
In a post hoc final analysis by investigators, mPFS was 25.0 months with LUTATHERA + SSA vs 8.5 months with SSA alone (HR, 0.30 [95% CI, 0.21-0.44])3
The updated PFS analyses are based on post hoc assessments conducted after the prespecified primary analysis and are observational only. They were not powered for statistical significance and the results should be interpreted with caution
No new safety signals were reported in the 5-year long-term follow-up for NETTER-15,*
*Cutoff date for final analysis was January 18, 2021.3
NCCN Clinical Practice Guidelines In Oncology (NCCN Guidelines®) select recommendations6
PRRT with lutetium Lu 177 dotatate (LUTATHERA®) is NCCN Guidelines® recommended as a systemic therapy option for SSTR+, well-differentiated GEP-NET patients*
Grade 1/2
NCCN Category 1 Preferred for locoregional advanced disease and/or distant metastases—mid-gut NETs with progression on octreotide LAR/lanreotide
Category 2A Preferred for locoregional advanced disease and/or distant metastases of gastrointestinal or pancreatic NETs after progression on octreotide LAR/lanreotide
NCCN Guidelines recommendations for 2L are based on data from the NETTER-1 study6
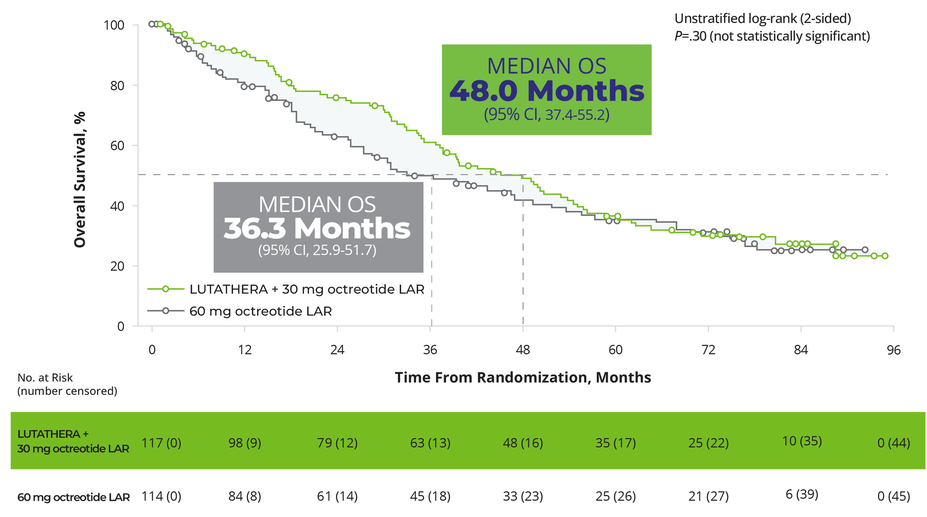
Patients receiving LUTATHERA achieved a clinically meaningful OS benefit5,*,†
OS in the ITT Population (Final Analysis)5,‡,§
In the final OS analysis, there was no statistically significant difference between the 2 treatment arms; however, the results were clinically meaningful5
Certain data from the final analysis are not included in the full Prescribing Information for LUTATHERA
At the time of the final OS analysis (66 months after the primary PFS analysis), 117 patients were randomized to the LUTATHERA arm and 114 patients were randomized to the octreotide arm
36% patients (41 of 114) treated with SSA alone received subsequent PRRT during the long-term follow-up5
*The analysis did not meet the requirements for statistical significance.
†The required assumptions for the Cox model for OS were not fulfilled, therefore making the HR uninterpretable.
‡The prespecified final analysis of OS was completed 5 years after the last patient was randomized because this occurred before the alternative cutoff of 158 deaths (data cutoff: January 18, 2021).5
§Included 2 patients randomized after the primary PFS analysis data cutoff (July 24, 2015). Median duration of follow-up was 76.3 months in the LUTATHERA arm and 76.5 months in the control arm.5
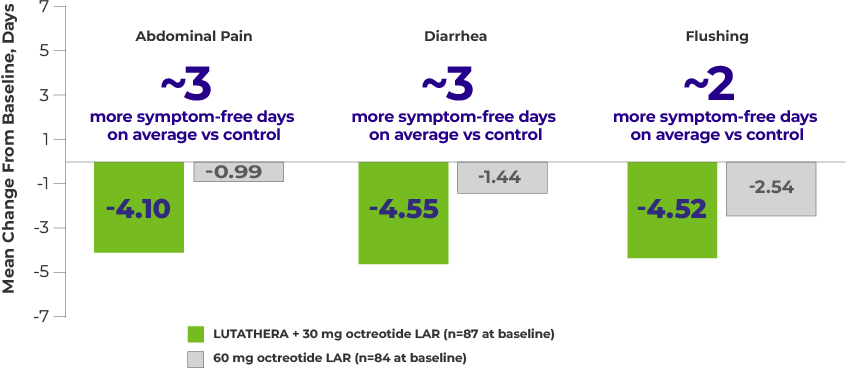
Patients reported more symptom-free days per month with LUTATHERA5
Mean Change From Baseline in Number of Days With Symptoms per 4-Week Period5,a
Shown above are the 3 symptoms considered most clinically relevant to patients with midgut NETs.
Patient symptom diaries data
Data from the patient symptom diaries should be interpreted with caution
Patient symptom diaries are a nonvalidated instrument collected per protocol in NETTER-1; analysis methods for symptom scores were not prespecified; patients were unable to be blinded to treatment due to the open-label nature of the trial; and n values decreased over time
Patient symptom diaries data are not included in the Prescribing Information for LUTATHERA
Study Analysis: Patients enrolled in the NETTER-1 trial were asked to record the presence or absence (in the preceding 24 hours) of 18 predefined symptoms in a paper-based, daily diary. A “symptom score” was defined as the number of days with each symptom within the 4-week period between clinic visits during treatment. The change from baseline in the mean number of days with symptoms was assessed using a mixed model for repeated measures, adjusting for baseline symptom status, time from randomization, treatment, and the interaction between time from randomization and treatment.5
Study design
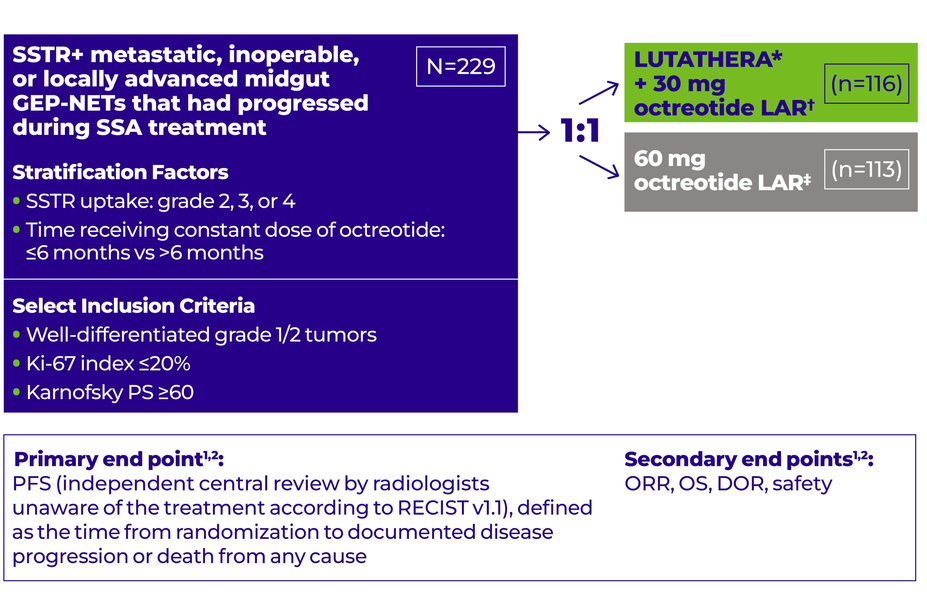
NETTER-1: A phase 3, randomized, open-label, multicenter study in 229 patients with well-differentiated, grade 1/2 advanced GEP-NETs after SSA progression1,2,7
*LUTATHERA: 4 cycles, 7.4 GBq (200 mCi) every 8 weeks (+/-1 week), maximum cumulative dose 29.6 GBq.1,2
†Octreotide LAR: 30 mg 4 to 24 hours after each LUTATHERA dose and then every 4 weeks after completion of treatment with LUTATHERA until disease progression or until Week 76 of the study.1,2
‡Octreotide LAR: 60 mg every 4 weeks.1,2
LUTATHERA is the first and only approved radioligand therapy with proven results in a pivotal trial of >200 2L patients1,2,7,8
NETTER-1 included patients with9:
Metastatic or locally advanced, inoperable GEP-NETs
Treatment with 20 or 30 mg octreotide LAR for at least 12 weeks prior to randomization
NETTER-1 excluded patients with9:
Treatment with >30 mg octreotide LAR ≤12 weeks before randomization
Prior treatment with radioligand therapy
Prior external beam radiation therapy to >25% of the bone marrow
Any surgery, radioembolization, chemoembolization, chemotherapy, and/or radiofrequency ablation ≤12 weeks before randomization
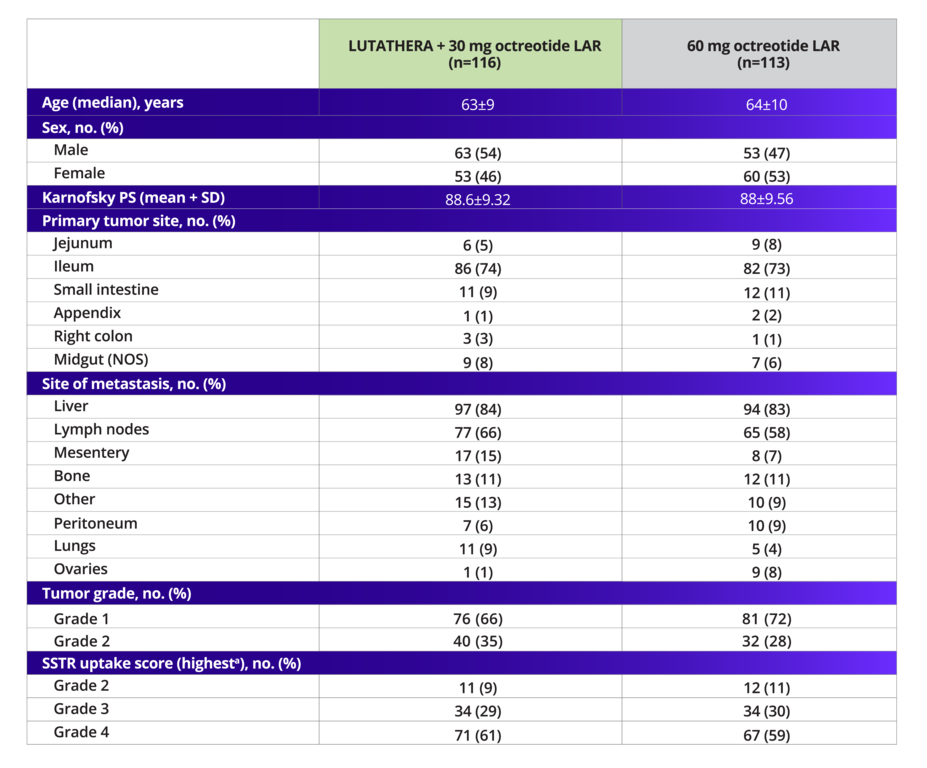
NETTER-1 demographics and disease characteristics were well balanced1,2,7
Baseline Demographics and Disease Characteristics
In the NETTER-1 trial, ~69% of patients had grade 1 NETs and ~31% had grade 2 NETs
2L, second line; DOR, duration of response; GBq, gigabecquerel; GEP-NETs, gastroenteropancreatic neuroendocrine tumors; HR, hazard ratio; ITT, intent-to-treat; LAR, long-acting release; mCi, millicurie; mPFS, median progression-free survival; NCCN, National Comprehensive Cancer Network; NE, not evaluable; NETs, neuroendocrine tumors; NOS, not otherwise specified; ORR, objective response rate; OS, overall survival; PFS, progression-free survival; PRRT, peptide receptor radionuclide therapy; PS, performance score; RECIST, Response Evaluation Criteria in Solid Tumors; SD, standard deviation; SSA, somatostatin analogue; SSTR, somatostatin receptor; SSTR+, somatostatin receptor-positive.


![LUTATHERA + SSA prolonged PFS in patients with grade 1/2 advanced GEP-NETs, with a 79% reduction in risk of progression or death (HR, 0.21 [95% CI, 0.13-0.32]; P<.0001). The median PFS in the LUTATHERA arm was not reached at primary analysis (95% CI, 18.4-NE) vs 8.5 months (95% CI, 6-9.1) in the control arm of 60 mg octreotide. There were 27 events (15 progressive disease, 12 deaths) in the LUTATHERA arm compared to 78 (61 progressive disease, 17 deaths) in the 60 mg octreotide LAR control arm.](https://usim.beprod.lutathera-hcp.com/sites/lutathera_hcp_com/files/styles/common_width_927/public/2025-08/lutathera_hcp_website_79km_chart_rgb_desktop_new.png?itok=mKf4hsU7)


